One small containerAn insulator such as cotton, wool, cardboard, or newspaperTwo thermometersHot water
Now it’s time to set up your investigation: Now you should have two thermometers: one measuring the temperature of the water in the container and one measuring the temperature of the air. Start the investigation:
Record the initial temperature measured by each thermometer.Continue to record the temperature of the water every 30 seconds for the next 10 minutes. You can let the experiment go longer if you wish.Over this time, the temperature of the air should remain fairly constant. If it begins to deviate by more than two degrees, pick a different location that has a more constant temperature and start your investigation again. Once the experiment is completed, create a plot of your data. Place the temperature of the water on the y-axis (vertical axis) of your graph, and the times on the x-axis (horizontal axis). Plot your data points using these axes.
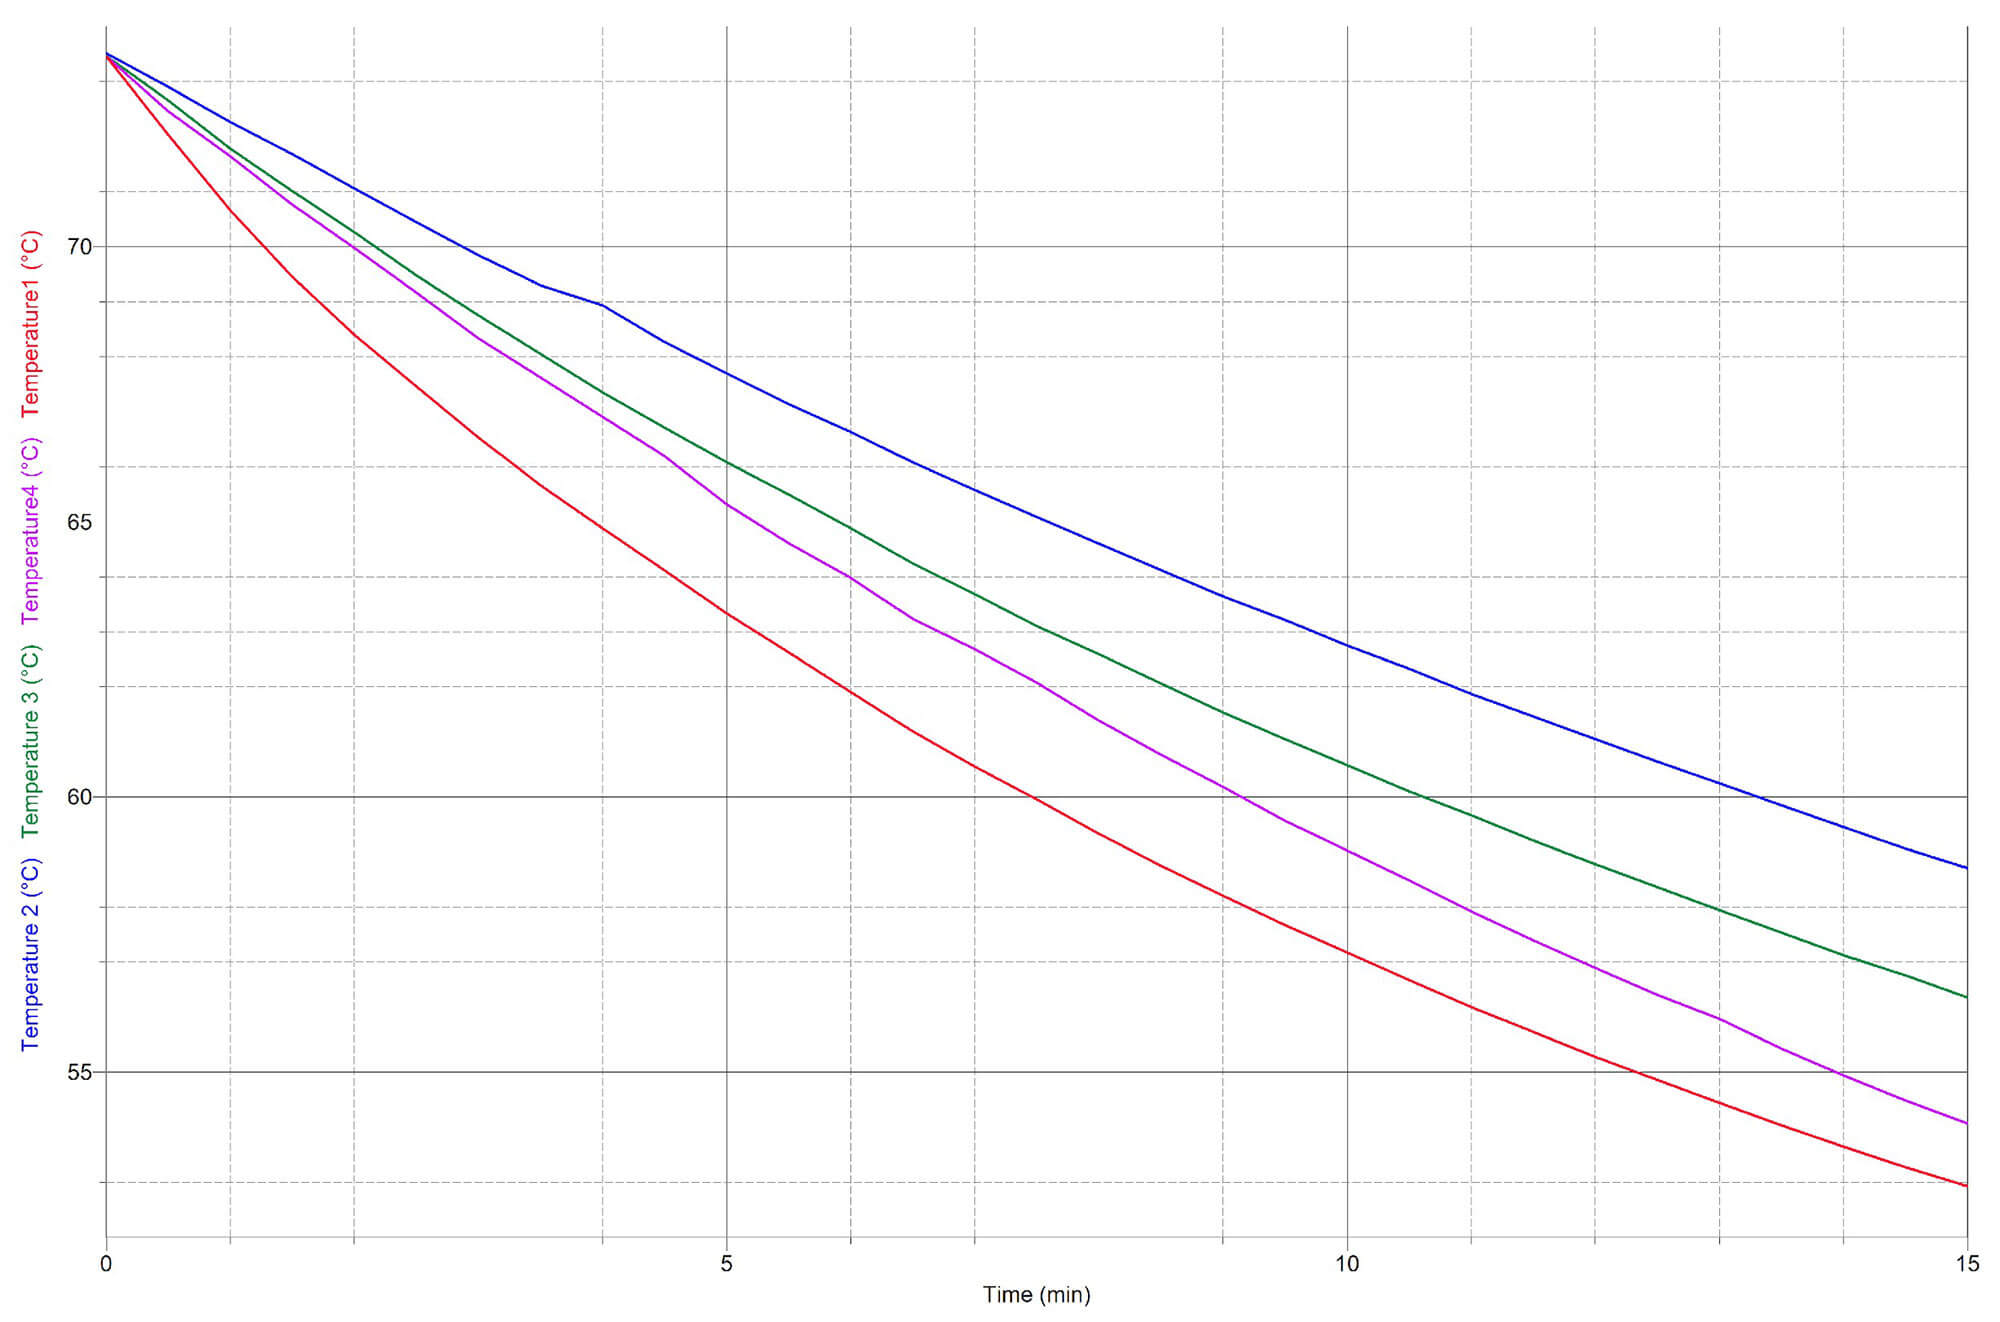
When plotted, your data should produce a curved graph that shows how the water in the container cooled: This is the third piece in a four-part Science for Students series. Read part one and part two, and check back next week for part four! Mike Willard is a physics and environmental science teacher at Richard Montgomery High School in Rockville, MD. He is also involved in a number of engineering and environmental education outreach programs through the school. You can contact him at Michael_J_Willard@mcpsmd.org.